Tabla de Contenidos
Utilidades de Red
Conectividad
Agregar ruta estatica
ip route add 192.168.55.0/24 via 192.168.1.254 dev eth1
route add -net 192.168.55.0 netmask 255.255.255.0 gw 192.168.1.254 dev eth1
Forzar el modo ethernet
Ejemplo, forzar a 100M Full duplex sin autonegociacion a la eth0
ethtool -s eth0 speed 100 duplex full autoneg off
Conectarse a redes Wi Fi
Primero bajamos el servicio de Network Manager si es que lo tenemos instalado
service NetworkMananger stop
Ejecutamos un scan sobre la interfaz para ver si encontró alguna red
iwlist wlan0 scan
Establecemos el ESSID y el AP
iwconfig wlan0 essid Wireless
iwconfig wlan0 ap 00:A0:C5:77:FC:7E
Si tiene clave
iwconfig wlan0 key PASSWORD
Ejecutamos iwconfig para ver si tomo todo y despues a tomar ip
dhclient wlan0
Script para parsear el iwlist scan
Salida de ejemplo
Name    Address             Quality   Channel   Encryption
wifi_1  01:23:45:67:89:AB   100 %     11        WPA v.1
wifi_2  01:23:45:67:89:AC    76 %     11        WEP
wifi_3  01:23:45:67:89:AD    51 %     11        Open
wifi_4  01:23:45:67:89:AE    50 %     11        WPA v.1
wifi_5  01:23:45:67:89:AF    43 %     4         Open
wifi_6  01:23:45:67:89:AG    43 %     4         WPA v.1
Script : iwlist wlan0 scan | iwlistparse.py
#!/usr/bin/env python
#
# iwlistparse.py
# Hugo Chargois - 17 jan. 2010 - v.0.1
# Parses the output of iwlist scan into a table

import sys

# You can add or change the functions to parse the properties of each AP (cell)
# below. They take one argument, the bunch of text describing one cell in iwlist
# scan and return a property of that cell.

def get_name(cell):
    return matching_line(cell,"ESSID:")[1:-1]

def get_quality(cell):
    quality = matching_line(cell,"Quality=").split()[0].split('/')
    return str(int(round(float(quality[0]) / float(quality[1]) * 100))).rjust(3) + " %"

def get_channel(cell):
    return matching_line(cell,"Channel:")

def get_encryption(cell):
    enc=""
    if matching_line(cell,"Encryption key:") == "off":
        enc="Open"
    else:
        for line in cell:
            matching = match(line,"IE:")
            if matching!=None:
                wpa=match(matching,"WPA Version ")
                if wpa!=None:
                    enc="WPA v."+wpa
        if enc=="":
            enc="WEP"
    return enc

def get_address(cell):
    return matching_line(cell,"Address: ")

# Here's a dictionary of rules that will be applied to the description of each
# cell. The key will be the name of the column in the table. The value is a
# function defined above.

rules={"Name":get_name,
       "Quality":get_quality,
       "Channel":get_channel,
       "Encryption":get_encryption,
       "Address":get_address,
       }

# Here you can choose the way of sorting the table. sortby should be a key of
# the dictionary rules.

def sort_cells(cells):
    sortby = "Quality"
    reverse = True
    cells.sort(None, lambda el:el[sortby], reverse)

# You can choose which columns to display here, and most importantly in what order. Of
# course, they must exist as keys in the dict rules.

columns=["Name","Address","Quality","Channel","Encryption"]


# Below here goes the boring stuff. You shouldn't have to edit anything below
# this point

def matching_line(lines, keyword):
    """Returns the first matching line in a list of lines. See match()"""
    for line in lines:
        matching=match(line,keyword)
        if matching!=None:
            return matching
    return None

def match(line,keyword):
    """If the first part of line (modulo blanks) matches keyword,
    returns the end of that line. Otherwise returns None"""
    line=line.lstrip()
    length=len(keyword)
    if line[:length] == keyword:
        return line[length:]
    else:
        return None

def parse_cell(cell):
    """Applies the rules to the bunch of text describing a cell and returns the
    corresponding dictionary"""
    parsed_cell={}
    for key in rules:
        rule=rules[key]
        parsed_cell.update({key:rule(cell)})
    return parsed_cell

def print_table(table):
    widths=map(max,map(lambda l:map(len,l),zip(*table))) #functional magic

    justified_table = []
    for line in table:
        justified_line=[]
        for i,el in enumerate(line):
            justified_line.append(el.ljust(widths[i]+2))
        justified_table.append(justified_line)

    for line in justified_table:
        for el in line:
            print el,
        print

def print_cells(cells):
    table=[columns]
    for cell in cells:
        cell_properties=[]
        for column in columns:
            cell_properties.append(cell[column])
        table.append(cell_properties)
    print_table(table)

def main():
    """Pretty prints the output of iwlist scan into a table"""
    cells=[[]]
    parsed_cells=[]

    for line in sys.stdin:
        cell_line = match(line,"Cell ")
        if cell_line != None:
            cells.append([])
            line = cell_line[-27:]
        cells[-1].append(line.rstrip())

    cells=cells[1:]

    for cell in cells:
        parsed_cells.append(parse_cell(cell))

    sort_cells(parsed_cells)

    print_cells(parsed_cells)

main()
Sacado de : http://bbs.archlinux.org/viewtopic.php?id=88967
Analisis de volcados tcpdump
Tcpdstat
Written by Kenjiro Cho, tcpdstat is a powerful tool that performs an in-depth protocol breakdown by bytes and packets. It further displays average and maximum transfer rates, IP flow information, and packet size distribution. Dave Dittrich applied several tweaks the tool to support a broader range of protocols and services, and to report more details about flow rates.
Here is an example output (of Dave's enhanced version):
DumpFile:  trace.pcap
FileSize: 98876.89MB
Id: 200703011241
StartTime: (anonymized)
EndTime:   (anonymized)
TotalTime: 7216.13 seconds
TotalCapSize: 96826.91MB  CapLen: 1514 bytes
# of packets: 134347439 (96826.91MB)
AvgRate: 113.10Mbps  stddev:47.96M   PeakRate: 260.92Mbps

### IP flow (unique src/dst pair) Information ###
# of flows: 1612801  (avg. 83.30 pkts/flow)
Top 10 big flow size (bytes/total in %):
 33.6%  3.2%  2.2%  1.5%  1.4%  1.0%  1.0%  0.9%  0.8%  0.8%

### IP address Information ###
# of IPv4 addresses: 480065
Top 10 bandwidth usage (bytes/total in %):
 34.4% 34.4%  3.3%  3.3%  3.0%  2.7%  2.3%  1.8%  1.5%  1.5%

### Packet Size Distribution (including MAC headers) ###
< <<<
 [   32-   63]:   20839652
 [   64-  127]:   38798140
 [  128-  255]:    3947049
 [  256-  511]:    3746280
 [  512- 1023]:    5675556
 [ 1024- 2047]:   61340762
>>>>


### Protocol Breakdown ###
< <<<
     protocol           packets                 bytes           bytes/pkt
------------------------------------------------------------------------
[0] total        134347439 (100.00%)     101530372750 (100.00%)    755.73
[1] ip           134347439 (100.00%)     101530372750 (100.00%)    755.73
[2]  tcp         118172509 ( 87.96%)      97361936181 ( 95.89%)    823.90
[3]   ftpdata        18640 (  0.01%)         16529412 (  0.02%)    886.77
[3]   ftp            72372 (  0.05%)          4697330 (  0.00%)     64.91
[3]   ssh         13849679 ( 10.31%)      11113777353 ( 10.95%)    802.46
[3]   telnet          9007 (  0.01%)          1526445 (  0.00%)    169.47
[3]   smtp         2133471 (  1.59%)       1447293494 (  1.43%)    678.38
[3]   name              23 (  0.00%)             1426 (  0.00%)     62.00
[3]   dns            35071 (  0.03%)          7071657 (  0.01%)    201.64
[3]   http(s)     25043480 ( 18.64%)      30677552254 ( 30.22%)   1224.97
[3]   http(c)     16165378 ( 12.03%)       2182851897 (  2.15%)    135.03
[3]   kerb5            370 (  0.00%)            30610 (  0.00%)     82.73
[3]   pop3           82382 (  0.06%)         26718043 (  0.03%)    324.32
[3]   sunrpc            30 (  0.00%)             3002 (  0.00%)    100.07
[3]   ident           5107 (  0.00%)           322074 (  0.00%)     63.07
[3]   nntp            1262 (  0.00%)           292679 (  0.00%)    231.92
[3]   epmap         209144 (  0.16%)         12909976 (  0.01%)     61.73
[3]   netb-se       404237 (  0.30%)         47178014 (  0.05%)    116.71
[3]   imap          125983 (  0.09%)        100889454 (  0.10%)    800.82
[3]   bgp              482 (  0.00%)            43139 (  0.00%)     89.50
[3]   ldap            7131 (  0.01%)          1434769 (  0.00%)    201.20
[3]   https        2941177 (  2.19%)       1802114169 (  1.77%)    612.72
[3]   ms-ds         245214 (  0.18%)         24263111 (  0.02%)     98.95
[3]   rtsp         1023246 (  0.76%)        691696863 (  0.68%)    675.98
[3]   ldaps           2828 (  0.00%)           209272 (  0.00%)     74.00
[3]   socks           7883 (  0.01%)          1340672 (  0.00%)    170.07
[3]   kasaa          13348 (  0.01%)          1124944 (  0.00%)     84.28
[3]   mssql-s       309786 (  0.23%)         20411848 (  0.02%)     65.89
[3]   squid          51381 (  0.04%)         14079861 (  0.01%)    274.03
[3]   ms-gc           1865 (  0.00%)           493682 (  0.00%)    264.71
[3]   ms-gcs          2034 (  0.00%)           481178 (  0.00%)    236.57
[3]   hotline            6 (  0.00%)              682 (  0.00%)    113.67
[3]   realaud        19784 (  0.01%)         13197979 (  0.01%)    667.10
[3]   icecast       390203 (  0.29%)        291651836 (  0.29%)    747.44
[3]   gnu6346         6324 (  0.00%)          1048473 (  0.00%)    165.79
[3]   gnu6348          342 (  0.00%)            26047 (  0.00%)     76.16
[3]   gnu6349           14 (  0.00%)             2767 (  0.00%)    197.64
[3]   gnu6350            4 (  0.00%)              732 (  0.00%)    183.00
[3]   irc6666            7 (  0.00%)              434 (  0.00%)     62.00
[3]   irc6667         1379 (  0.00%)           196155 (  0.00%)    142.24
[3]   irc6668            2 (  0.00%)              124 (  0.00%)     62.00
[3]   irc6669            9 (  0.00%)              666 (  0.00%)     74.00
[3]   napster           21 (  0.00%)             1344 (  0.00%)     64.00
[3]   irc7000            7 (  0.00%)              824 (  0.00%)    117.71
[3]   http-a        129807 (  0.10%)         71136838 (  0.07%)    548.02
[3]   other       54862568 ( 40.84%)      48787331392 ( 48.05%)    889.26
[2]  udp          13069221 (  9.73%)       3895596348 (  3.84%)    298.07
[3]   name              18 (  0.00%)             1989 (  0.00%)    110.50
[3]   dns          1799081 (  1.34%)        264263480 (  0.26%)    146.89
[3]   kerb5            100 (  0.00%)            25812 (  0.00%)    258.12
[3]   sunrpc           581 (  0.00%)            57157 (  0.00%)     98.38
[3]   ntp            50387 (  0.04%)          4534933 (  0.00%)     90.00
[3]   epmap             17 (  0.00%)             1824 (  0.00%)    107.29
[3]   netb-ns       148619 (  0.11%)         14736588 (  0.01%)     99.16
[3]   netb-se         1272 (  0.00%)           328673 (  0.00%)    258.39
[3]   ms-ds              8 (  0.00%)              883 (  0.00%)    110.38
[3]   kazaa             29 (  0.00%)             3546 (  0.00%)    122.28
[3]   mssql-s           44 (  0.00%)             3832 (  0.00%)     87.09
[3]   mcast        7216682 (  5.37%)       1943012688 (  1.91%)    269.24
[3]   realaud       459195 (  0.34%)        273532235 (  0.27%)    595.68
[3]   halflif           81 (  0.00%)             5890 (  0.00%)     72.72
[3]   starcra           45 (  0.00%)             6367 (  0.00%)    141.49
[3]   everque            9 (  0.00%)             1351 (  0.00%)    150.11
[3]   unreal          1066 (  0.00%)            93951 (  0.00%)     88.13
[3]   quake             20 (  0.00%)             1860 (  0.00%)     93.00
[3]   other        3384119 (  2.52%)       1394472416 (  1.37%)    412.06
[2]  icmp          3105709 (  2.31%)        272840221 (  0.27%)     87.85
[2]  frag            30903 (  0.02%)         25672129 (  0.03%)    830.73
>>>>
Ref.:http://matthias.vallentin.net/2007/01/examining-and-dissecting-tcpdumplibpcap.html
Firewall
IPTState
IPTState is a top-like interface to your netfilter connection-tracking table. Using iptstate you interactively watch where traffic crossing your netfilter/iptables firewall is going, sort by various criteria, limit the view by various criteria
Sniffers y mediciones
Tcptrack
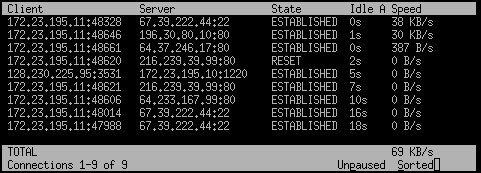
tcptrack is a sniffer which displays information about TCP connections it sees on a network interface. It passively watches for connections on the network interface, keeps track of their state and displays a list of connections in a manner similar to the unix 'top' command. It displays source and destination addresses and ports, connection state, idle time, and bandwidth usage. The following screenshot explains a lot:
La sintaxis es similar a la de tcpdump
# tcptrack -i eth0 port 80
# tcptrack -i eth0 host 192.168.2.110 and port 8080
#tcptrack  -i eth0 src or dst 74.125.47.138 or src or dst 74.125.47.139 or src or dst 74.125.47.101 or src or dst 74.125.47.138 or src or dst 208.117.252.210 or src or dst 74.125.47.102 or src or dst s2.youtube.com or src or dst youtube.com or src or dst 208.117.252.210 or src or dst 208.117.252.22 or src or dst 208.117.252.167 or src or dst 208.117.252.22 or src or dst www.youtube.com or src or dst 208.117.252.228 or src or dst 208.117.252.23 or src or dst 74.125.47.101  or src or dst 208.117.252.159 or src or dst 74.125.47.102 or src or dst 208.117.252.18
Bmon
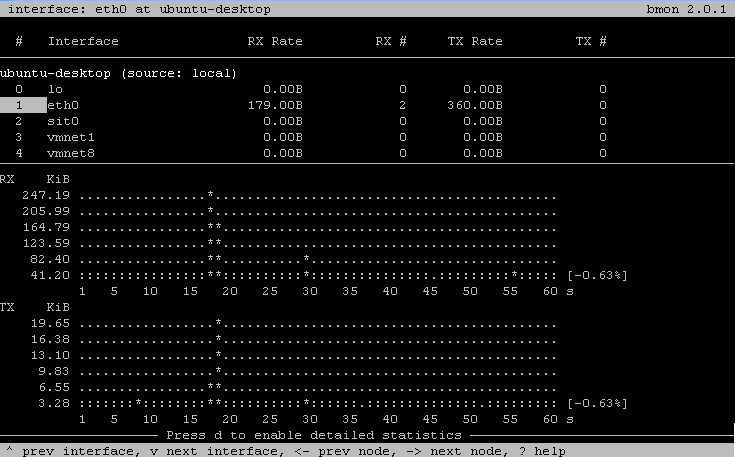
bmon is a portable bandwidth monitor with multiple input methods and output modes. A set of architecture specific input modules provide the core with the listof interfaces and their counters. The core stores this counters and provides rate estimation including a history over the last 60 seconds, minutes, hours and days to the output modules which output them according to the configuration.
Para instalarlo
apt-get install bmon
Sqstat
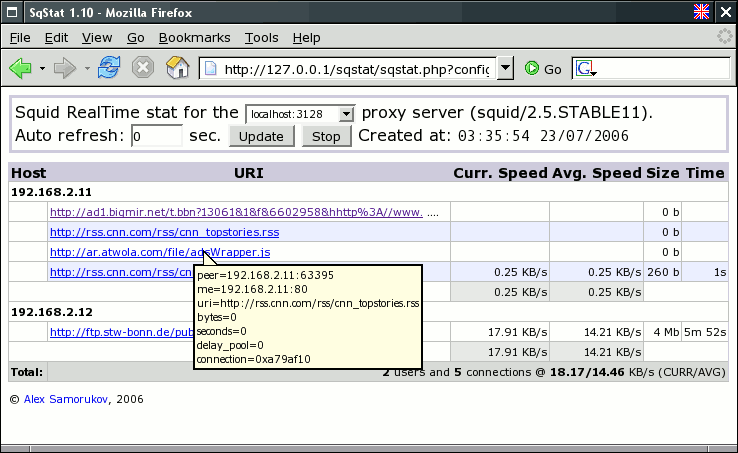
SqStat is a script which allows to look through active squid users connections. It use cachemgr protocol to get information from squid proxy server
Hydra
A very fast network logon cracker which support many different services
Currently this tool supports: TELNET, FTP, HTTP, HTTPS, HTTP-PROXY, SMB, SMBNT, MS-SQL, MYSQL, REXEC, RSH, RLOGIN, CVS, SNMP, SMTP-AUTH, SOCKS5, VNC, POP3, IMAP, NNTP, PCNFS, ICQ, SAP/R3, LDAP2, LDAP3, Postgres, Teamspeak, Cisco auth, Cisco enable, AFP, Subversion/SVN, Firebird, LDAP2, Cisco AAA (incorporated in telnet module).
For HTTP, POP3, IMAP and SMTP, several login mechanisms like plain and MD5 digest are supported.
Python Proxy
Mini Proxy en Python
http://code.google.com/p/python-proxy/
sergio@sergio-thinkcentre-a70z:~$ python PythonProxy.py
Serving on 0.0.0.0:8080.
GET http://backports.debian.org/debian-backports/dists/lenny-backports/Release.gpg HTTP/1.1
GET http://ftp.de.debian.org/debian/dists/stable/Release.gpg HTTP/1.1
GET http://security.debian.org/dists/lenny/updates/Release.gpg HTTP/1.1
Parser y formateador de salida NMap
Algo muy útil a la hora de hacer reporte de servidores en base a un archivo de lista de servidores, ej nmap-report.pl servidores.txt, imprimiendo la salida por pantalla en formato dokuwiki.
#!/usr/bin/perl
BEGIN {
    eval "use Nmap::Scanner";
    if ( $@ ) {
    warn  "Error to load module: Nmap::Scanner\n"
    . "Install Module:\n"
    . "\t\tcpan> install Nmap::Scanner\n";
    exit ();
 }
}

use POSIX qw(strftime);
my $scanner = new Nmap::Scanner;
$scanner->guess_os();
$scanner->register_scan_complete_event(\&scan_complete);
$scanner->register_scan_started_event(\&scan_started);
$scanner->register_port_found_event(\&port_found);
my $lista = $ARGV[0];
my $opciones_scan = "-sS -A -vv -p0-65535 -sV -O -iL $lista";
print "Options Nmap: $opciones_scan\n";
print "^^Puerto^Estado^Servicio^Informacion^^\n";
$scanner->scan($opciones_scan);

sub scan_started {
        my $self     = shift;
        my $host     = shift;
        $hostname = $host->hostname();
        $addresses = join(',', map {$_->addr()} $host->addresses());
        my $status = $host->status();
#        print "$hostname ($addresses)\n";
}

sub port_found {
        my $self     = shift;
        my $host     = shift;
        my $port     = shift;
        no warnings;
        my $name = $host->hostname();
        my $puerto = $port->state();
        if ($puerto eq "open"){$pestado="abierto";}
        elsif($puerto eq "closed"){     $pestado="cerrado";}
        my $proto= $port->protocol();
        if ($proto eq "tcp"){$protoc="tcp";}
        elsif($proto eq "udp"){$protoc="udp";}
        my $salida_puerto = join('',"|",$port->portid(),"/",$protoc,"|",$pestado,"|",$port->service()->name(),"|",$port->service()->product()," ",$port->service()->version()," ",$port->service()->extrainfo(),"|");
        print "$salida_puerto\n";
}

sub scan_complete {
    my $self = shift;
    my $host = shift;
    no warnings;

   for my $match ($host->os()->osmatches()) {
        print "\n\n\nHost determinado aproximadamente: " . $match->name(),"\n\n";
    }

    for my $c ($host->os()->osclasses()) {
#        print "-- " . $c->vendor() . "\n";
        print "- OS generation: " . $c->osgen() . "\n\n";
        print "- OS family:     " . $c->osfamily() . "\n\n";
        print "- OS Type:       " . $c->type() . "\n\n";
    }
}
hping3
hping3 is a free packet generator and analyzer for the TCP/IP protocol. Hping is one of the de-facto tools for security auditing and testing of firewalls and networks, and was used to exploit the Idle Scan scanning technique now implemented in the Nmap port scanner. The new version of hping, hping3, is scriptable using the Tcl language and implements an engine for string based, human readable description of TCP/IP packets, so that the programmer can write scripts related to low level TCP/IP packet manipulation and analysis in a very short time.
Like most tools used in computer security, hping3 is useful to security experts.
hping3 should be used to… *Traceroute/ping/probe hosts behind a firewall that blocks attempts using the standard utilities. *Perform the idle scan (now implemented in nmap with an easy user interface). *Test firewalling rules. *Test IDSes. *Perform DDOS attack *Exploit known vulnerabilties of TCP/IP stacks. *Networking research. *Learn TCP/IP (hping was used in networking courses). *Write real applications related to TCP/IP testing and security. *Automated firewalling tests. *Proof of concept exploits. *Networking and security research when there is the need to emulate complex TCP/IP behaviour. *Prototype IDS systems.
Few commands
Finding Hping3
hping3 –h
hping3 Default
hping3 -S 192.168.1.105 -p 80
Fragment Packets with hping3
hping3 -f 192.168.1.105 -p 80
Sending Data with hping3
hping3 -f 192.168.1.105 -p 80 -d 10 -E malware
Traceroute with hping3
hping3 -z -t 1 -S google.com -p 80
Predicting Sequence Numbers with hping3
hping3 -Q -S google.com -p 80
hping3 for Uptime
hping3 --tcp-timestamp -S google.com -p 80
Ref.: @cyberhawksecurity


